ECS LIVA Q3D and ACEMAGIC T8 Plus micro-PCs Review: Jasper Lake and Alder Lake-N in a Smaller-than-UCFF Package
by Ganesh T S on September 21, 2023 9:10 AM EST- Posted in
- Systems
- Intel
- ECS
- LIVA
- Jasper Lake
- Alder Lake-N
- AceMagician
- micro-PC
System Performance: UL and BAPCo Benchmarks
Our 2022 Q4 update to the test suite for Windows 11-based systems carries over some of the standard benchmarks we have been using over the last several years. While UL's PCMark makes the list, we have opted to temporarily suspend reporting of BAPCo's SYSmark scores (pending fixture of the energy consumption aspect). Instead, BAPCO's CrossMark multi-platform benchmarking tool has been added to the set along with UL's Procyon suite. While CrossMark employs idle time compression and processes all workloads in an opaque manner, UL's Procyon processes real-world workloads with user interactions (like BAPCo's SYSmark). We have augmented the UL Procyon suite benchmark with our own custom energy measurement setup.
UL PCMark 10
UL's PCMark 10 evaluates computing systems for various usage scenarios (generic / essential tasks such as web browsing and starting up applications, productivity tasks such as editing spreadsheets and documents, gaming, and digital content creation). We benchmarked select PCs with the PCMark 10 Extended profile and recorded the scores for various scenarios. These scores are heavily influenced by the CPU and GPU in the system, though the RAM and storage device also play a part. The power plan was set to Balanced for all the PCs while processing the PCMark 10 benchmark. The scores for each contributing component / use-case environment are also graphed below.
| UL PCMark 10 - Performance Scores | |||
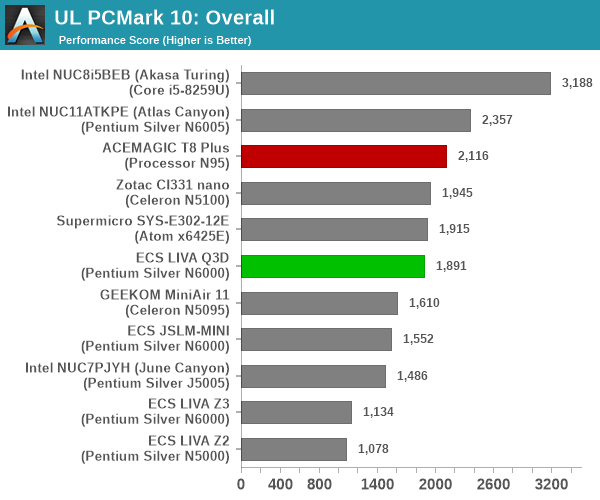
The ACEMAGIC T8 Plus enjoys a slight lead over the ECS LIVA Q3D in all the components, but the hopes of a significant generational update are somewhat dashed. This has more to do with the configured PL1 and PL2 values for both systems. ECS allows the Jasper Lake Pentium Silver N6000 to operate with PL1 and PL2 values of 10W and 25W despite its 6W TDP. On the other hand, ACEMAGIC's BIOS keeps these values same at 15W. The higher power budget allows the LIVA Q3D to put up creditable scores almost matching the newer generation T8 Plus in the PCMark 10 workloads.
UL Procyon v2.1.544
PCMark 10 utilizes open-source software such as Libre Office and GIMP to evaluate system performance. However, many of their professional benchmark customers have been requesting evaluation with commonly-used commercial software such as Microsoft Office and Adobe applications. In order to serve their needs, UL introduced the Procyon benchmark in late 2020. There are five benchmark categories currently - Office Productivity, AI Inference, Battery Life, Photo Editing, and Video Editing. AI Inference benchmarks are available only for Android devices, while the battery life benchmark is applicable to Windows devices such as notebooks and tablets. We presents results from our processing of the other three benchmarks.
We had been unable to process this benchmark on any of the Jasper Lake systems previously, and this didn't change with the ECS LIVA Q3D. The other compared systems are old ones on which we had not processed UL Procyon at all. Interestingly, the ADL-N-based T8 Plus completed the benchmark without any issues. We are recording the scores and energy consumption numbers for the T8 Plus here for use in future reviews.
| ACEMAGIC T8 Plus - UL Procyon 2.1.544 Scores and Energy Consumption | ||
| Workload | Score (Higher is Better) |
Energy Consumption (Wh) (Lower is Better) |
| Office Productivity - MS Excel | 3166 | |
| Office Productivity - MS Word | 4286 | |
| Office Productivity - MS Powerpoint | 3458 | |
| Office Productivity - MS Outlook | 3171 | |
| Office Productivity - Overall | 3541 | 7.5 |
| Photo Editing | 2539 | 10.31 |
| Video Editing | 876 | 69.38 |
Without a frame of reference, it is hard to evaluate the performance of the T8 Plus in this workload. We will get more context in future reviews of ADL-N-based systems.
BAPCo CrossMark 1.0.1.86
BAPCo's CrossMark aims to simplify benchmark processing while still delivering scores that roughly tally with SYSmark. The main advantage is the cross-platform nature of the tool - allowing it to be run on smartphones and tablets as well.
| BAPCo CrossMark 1.0.1.86 - Sub-Category Scores | |||
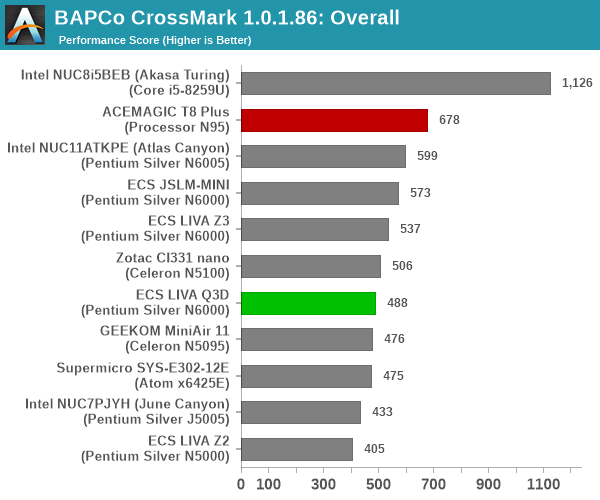
The relative performance seen in the UL PCMark 10 workloads also translate to BAPCo Crossmark. However, the gulf between the LIVA Q3D and the T8 Plus is much more pronounced due to the idle time compression scheme. This doesn't allow the processor in the LIVA Q3D to ramp up to 25W on a consistent basis, which pulls down the performance compared to ADL-N processor in the T8 Plus.


8 Comments
View All Comments
ballsystemlord - Thursday, September 21, 2023 - link
@Ganesh , Your pricing info makes it appear as though the coupon itself saves us $177. Please consider removing the "-" (minus) sign, use a comma or a semicolon instead.Samus - Thursday, September 21, 2023 - link
I'm just waiting for someone to chime in about how the Apple M2 is so much faster... XDballsystemlord - Friday, September 22, 2023 - link
Well, we can't disappoint you so...meacupla - Friday, September 22, 2023 - link
I too have never seen that SSD controller/nand maker.HGO? HSO?
That logo looks too similar to HOS from Patlabor
mode_13h - Monday, October 2, 2023 - link
Except that Labors, like Chobits, clearly had hard disks.sjkpublic@gmail.com - Friday, September 22, 2023 - link
Missing a proper NVME connection / controller? Looks like fastest disk speed is 600 MB/s.t.s - Sunday, September 24, 2023 - link
Thanks for the review.From the idle power side, it's quite high, cause my HP elitedesk 800 G4 65 watt can go as low as < 4W with i5-8500T. Asrock Deskmini x300 with ryzen 5700G is about ~12w idle. All measured from the wall.
mode_13h - Monday, October 2, 2023 - link
Let me know when there's a reasonably-priced (i.e. not industrial) Alder Lake-N mini-ITX board with DDR5 support. So far, I've yet to find one.