SanDisk Extreme Portable SSD v2 and WD My Passport SSD (2020) Review
by Ganesh T S on September 30, 2020 8:01 AM EST
External bus-powered storage devices have grown both in storage capacity as well as speeds over the last decade. Thanks to rapid advancements in flash technology (including the advent of 3D NAND and NVMe) as well as faster host interfaces (such as Thunderbolt 3 and USB 3.x), we now have palm-sized flash-based storage devices capable of delivering 2GBps+ speeds. While those speeds can be achieved with Thunderbolt 3, mass-market devices have to rely on USB. This review discusses the performance and characteristics of Western Digital's latest offerings (2020 catalog) supporting USB 3.1 Gen 2 (10 Gbps) speeds.
Introduction
High-performance external storage devices use either Thunderbolt 3 or USB 3.2 Gen 2 for the host interface. Traditional SATA SSDs (saturating at 560 MBps) can hardly take full advantage of the bandwidth offered by USB 3.2 Gen 2. In 2020, we have seen the market move en-masse to NVMe SSDs behind a USB 3.2 Gen 2 bridge for this market segment.
Western Digital brought NVMe support to their My Passport SSD product line last month. Today, the company is launching the SanDisk Extreme Portable SSD v2 (along with the Extreme PRO Portable SSD v2). The Extreme v2 is of particular interest here, as both the feature set and the performance specifications tally with that of the My Passport SSD. The company provided us with review samples of the 1TB versions of the My Passport SSD as well as the SanDisk Extreme Portable SSD v2.
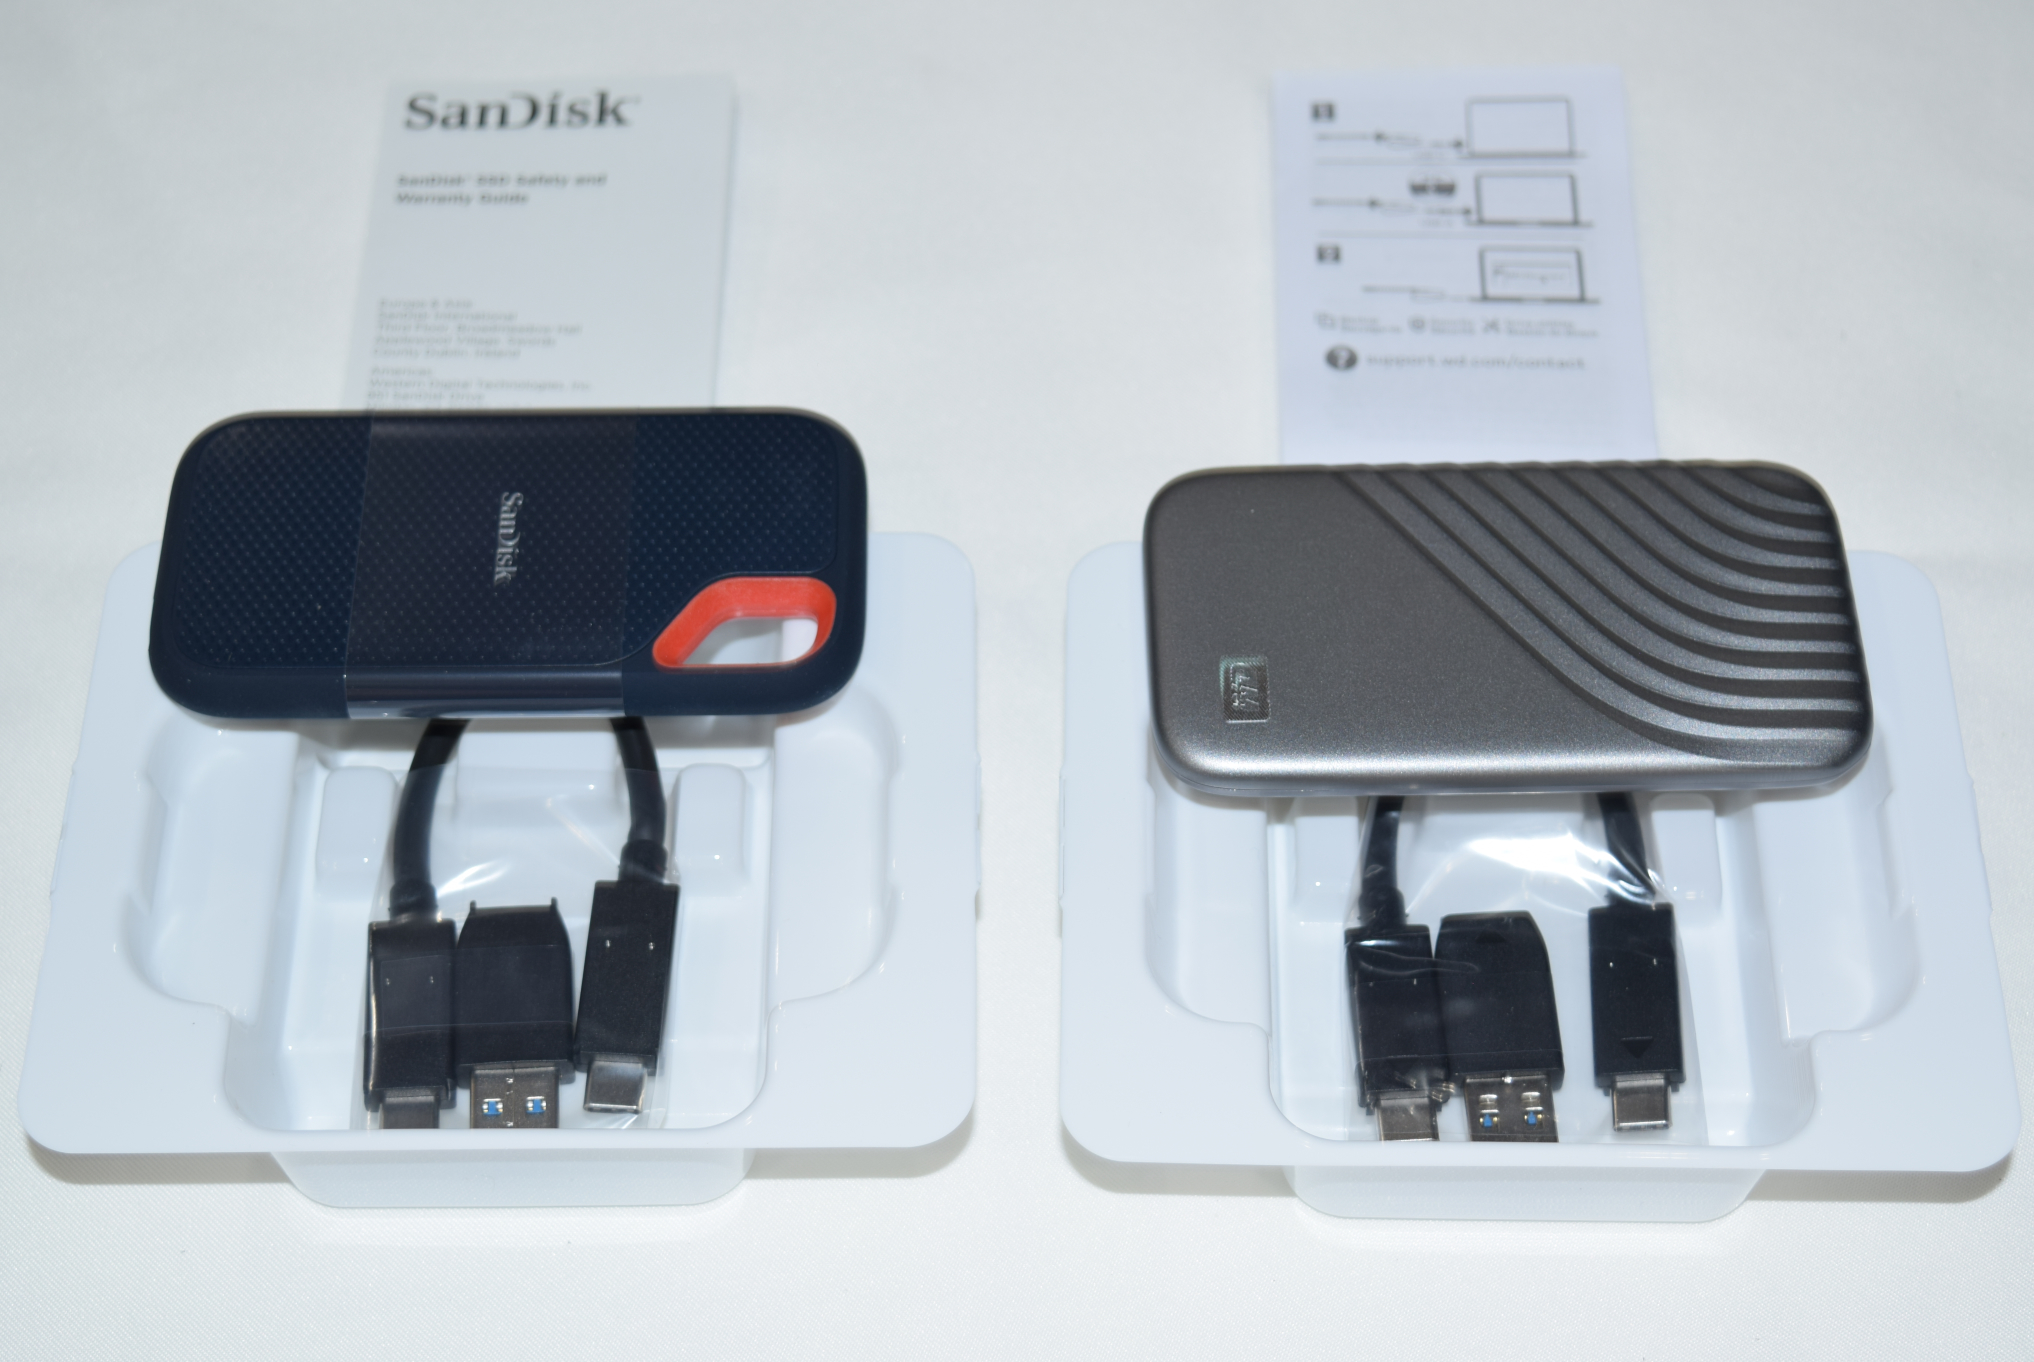
The two products are packaged similarly and both come with short (15cm) USB 3.2 Gen 2 Type-C to Type-C cables. A Type-C to Type-A adaptor is supplied, similar to the ones with the previous generation external SSDs from Western Digital. The industrial design of the units is quite different, each appealing to its own target market. The carabiner loop in the SanDisk Extreme / PRO line has proved to be a useful complement to the gumstick form-factor enforced by the usage of a M.2 NVMe SSD. It has been particularly appreciated by content creators (photographers and videographers) on the go. The My Passport SSD with its rounded edges and grooves / availability in multiple colors may hold appeal to the mainstream style-conscious audience. As we shall see further down in the 'Device Features & Characteristics' section, the internal hardware is identical. The rest of the review also tackles another interesting aspect - does the same internal hardware lead to similar performance profiles for the two SSDs?
In this review, we compare the SanDisk Extreme Portable SSD v2 and the WD My Passport SSD (2020) against each other, as well as the following DAS units that we have reviewed before.
- ADATA SE800 1TB
- Crucial Portable SSD X8 1TB
- HP P700 1TB
- Lexar SL100 Pro 1TB
- Patriot PXD 1TB
- Samsung Portable SSD T7 Touch 1TB
- SanDisk Extreme Pro Portable SSD 1TB
A quick overview of the internal capabilities of the storage devices is given by CrystalDiskInfo.
| Drive Information |
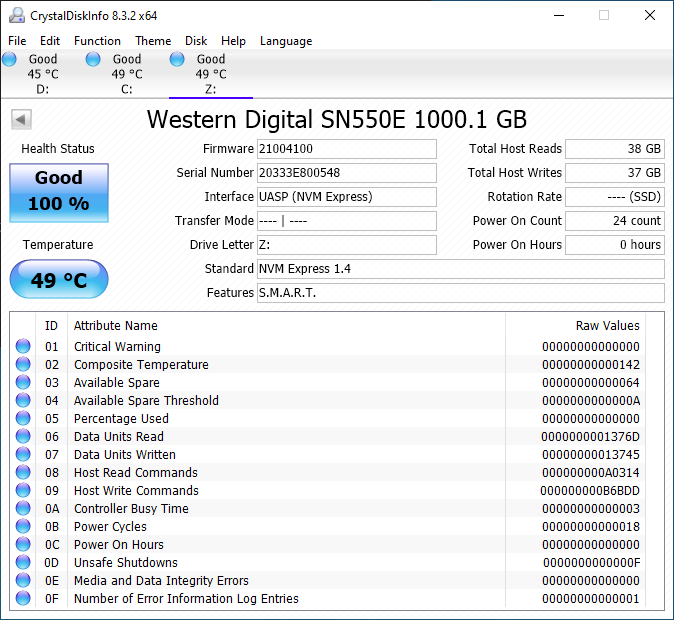 |
The SanDisk Extreme Portable SSD v2 and the WD My Passport SSD (2020) use the same internal SSD - the Western Digital SN550E. The SN550 is available in retail under the WD Blue branding. We believe that the 'E' suffix stands for 'External' - WD did confirm that the SSD being used was SN550-class, and it contained specific firmware tweaks for use as an external SSD. Like almost every other M.2 NVMe SSD behind a USB 3.2 Gen 2 bridge, the SanDisk Extreme Portable SSD v2 and the WD My Passport SSD (2020) support S.M.A.R.T. passthrough and TRIM (though it is not explicitly evident in the CrystalDiskInfo screenshot).


The gallery above presents some pictures of the internals of the WD My Passport SSD (2020). We see that the two sides of the My Passport SSD clamshell are held together by industrial-strength double sided tape. Prying apart the two at the seam was relatively painless - in fact, it was the easiest portable SSD to take apart (out of all the ones that I had worked on earlier). The SanDisk Extreme Portable SSD v2's top segment holds on to the bottom segment using a series of plastic clips in the inside perimeter - this is straightforward to take out using opening picks. Selected pictures are available in the gallery below.


Inside the unit, we see that a thermal pad right across the M.2 SSD (in the Extreme v2 teardown) and another on the reverse side (in the My Passport SSD teardown). In addition to helping remove the heat away, they also ensure that the boards are snug inside the enclosure and can withstand shocks and vibrations. Pictures of the ASMedia ASM2362 bridge chip can be seen in the main board, while the SanDisk 20-82-10023 controller can be seen in the M.2 SSD.
Testbed Setup and Testing Methodology
Evaluation of DAS units on Windows is done with a Hades Canyon NUC configured as outlined below. We use one of the rear USB Type-C ports enabled by the Alpine Ridge controller for both Thunderbolt 3 and USB devices.
| AnandTech DAS Testbed Configuration | |
| Motherboard | Intel NUC8i7HVB |
| CPU | Intel Core i7-8809G Kaby Lake, 4C/8T, 3.1GHz (up to 4.2GHz), 14nm+, 8MB L2 |
| Memory | Crucial Technology Ballistix DDR4-2400 SODIMM 2 x 16GB @ 16-16-16-39 |
| OS Drive | Intel Optane SSD 800p SSDPEK1W120GA (118 GB; M.2 Type 2280 PCIe 3.0 x2 NVMe; Optane) |
| SATA Devices | Intel SSD 545s SSDSCKKW512G8 (512 GB; M.2 Type 2280 SATA III; Intel 64L 3D TLC) |
| Chassis | Hades Canyon NUC |
| PSU | Lite-On 230W External Power Brick |
| OS | Windows 10 Enterprise x64 (v1909) |
| Thanks to Intel for the build components | |
Our evaluation methodology for direct-attached storage devices adopts a judicious mix of synthetic and real-world workloads. While most DAS units targeting a particular market segment advertise similar performance numbers and also meet them for common workloads, the real differentiation is brought out on the technical side by the performance consistency metric and the effectiveness of the thermal solution. Industrial design and value-added features may also be important for certain users. The remaining sections in this review tackle all of these aspects after analyzing the features of the drives in detail.
Device Features and Characteristics
Prior to looking at the usage characteristics of the SanDisk Extreme Portable SSD v2 and the WD My Passport SSD (2020), it is helpful to compare their specifications against other similar SSDs.
| Direct-Attached Storage Characteristics | ||
| Aspect | ||
| Upstream Port | USB 3.2 Gen 2 Type-C | USB 3.2 Gen 2 Type-C |
| Bridge / Controller | ASMedia ASM2362 + SanDisk 20-82-10023 | ASMedia ASM2362 + SanDisk 20-82-10023 |
| Flash | SanDisk BiCS 4 96L 3D TLC | SanDisk BiCS 4 96L 3D TLC |
| Power | Bus Powered | Bus Powered |
| Physical Dimensions | 52.42 mm x 100.54 mm x 8.95 mm | 55 mm x 100 mm x 9 mm |
| IP Rating | IP55 | N/A |
| Weight | 63 grams (without cable) | 54 grams (without cable) |
| Cable | 15 cm USB 3.2 Gen 2 Type-C to Type-C Type-C to Type-A Adaptor |
15 cm USB 3.2 Gen 2 Type-C to Type-C Type-C to Type-A Adaptor |
| S.M.A.R.T Passthrough | Yes | Yes |
| UASP Support | Yes | Yes |
| TRIM Passthrough | Yes | Yes |
| Encryption Support | Hardware (SanDisk SecureAccess App) | Hardware (WD Security App) |
The two SSDs have the shortest supplied cable lengths at 15cm. Tower desktop users with USB-C ports in the rear panel may need to keep this in mind. The drives feel solid in hand, thanks to their 50g+ weight. The WD My Passport SSD (2020) is slightly wider than the SanDisk Extreme v2, but both of them fit easily in pockets for carrying around.
Synthetic Benchmarks - ATTO and CrystalDiskMark
SanDisk claims speeds of up to 1050 MBps for the two SSDs, and these are almost backed up by the ATTO benchmarks provided below. Unfortunately, these access traces are not very common in real-life scenarios.
| Drive Performance Benchmarks - ATTO |
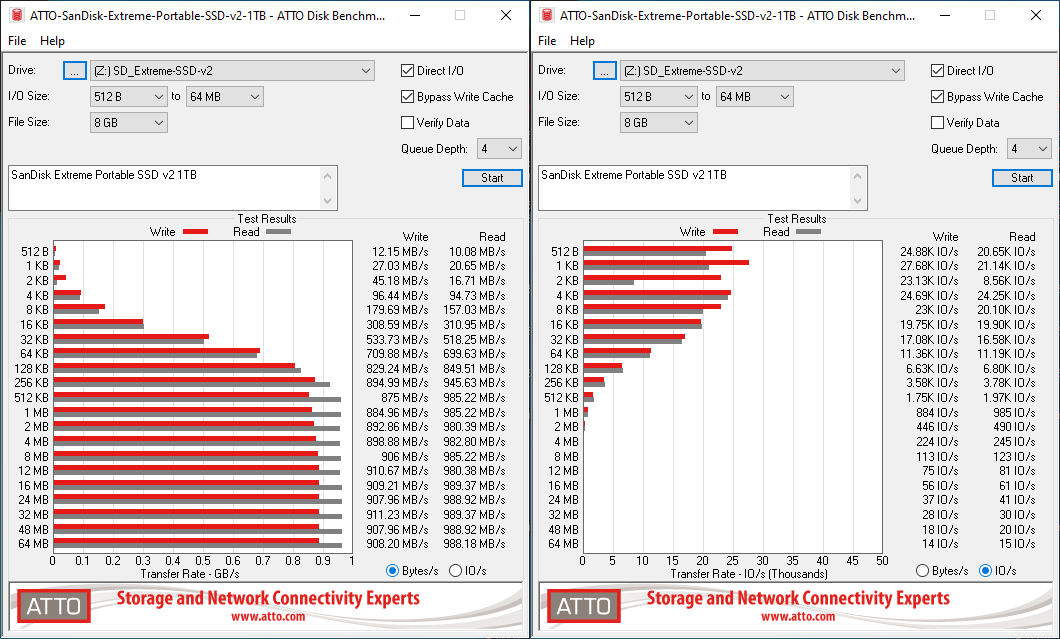 |
Speeds top out at 989 MBps reads and around 912 MBps writes for the two SSDs. An interesting point to note here is that the SanDisk Extreme Pro Portable SSD from last year had similar read numbers, but the writes went up to 929 MBps.
CrystalDiskMark, despite being a canned benchmark, provides a better estimate of the performance range with a selected set of numbers.
| Drive Performance Benchmarks - CrystalDiskMark |
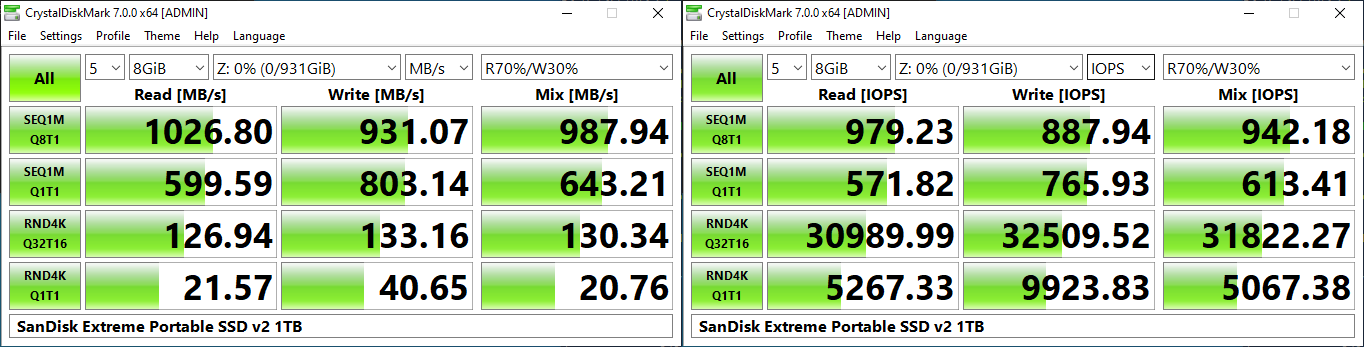 |
As evident from the screenshot above, the performance can dip to as low as 21 MBps for 4K random reads.
AnandTech DAS Suite - Benchmarking for Performance Consistency
Our testing methodology for DAS units takes into consideration the usual use-case for such devices. The most common usage scenario is transfer of large amounts of photos and videos to and from the unit. Other usage scenarios include the use of the DAS as a download or install location for games and importing files directly off the DAS into a multimedia editing program such as Adobe Photoshop. Some users may even opt to boot an OS off an external storage device.
The AnandTech DAS Suite tackles the first use-case. The evaluation involves processing three different workloads:
- Photos: 15.6 GB collection of 4320 photos (RAW as well as JPEGs) in 61 sub-folders
- Videos: 16.1 GB collection of 244 videos (MP4 as well as MOVs) in 6 sub-folders
- BR: 10.7 GB Blu-ray folder structure of the IDT Benchmark Blu-ray
Each workload's data set is first placed in a 25GB RAM drive, and a robocopy command is issued to transfer it to the DAS under test (formatted in NTFS). Upon completion of the transfer (write test), the contents from the DAS are read back into the RAM drive (read test). This process is repeated three times for each workload. Read and write speeds, as well as the time taken to complete each pass are recorded. Bandwidth for each data set is computed as the average of all three passes.
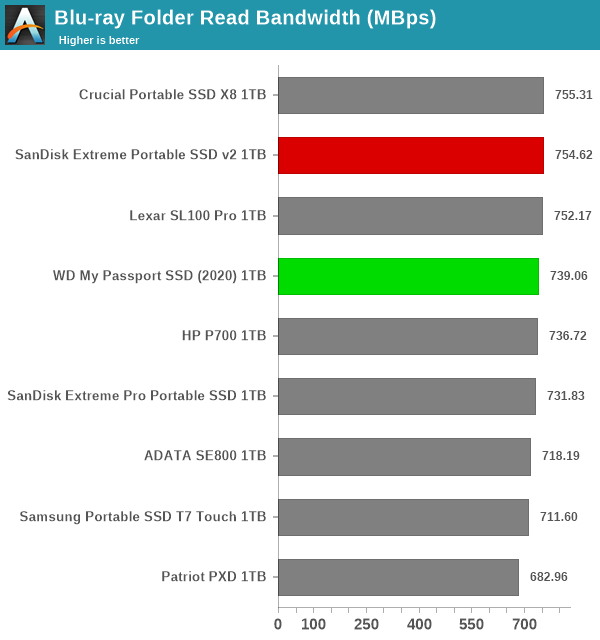
It can be seen that there is no significant gulf in the numbers between the different units. For all practical purposes, the casual user will notice no difference between them in the course of normal usage.However, power users may want to dig deeper to understand the limits of each device. To address this concern, we also instrumented our evaluation scheme for determining performance consistency.
Performance Consistency
Aspects influencing the performance consistency include SLC caching and thermal throttling / firmware caps on access rates to avoid overheating. This is important for power users, as the last thing that they want to see when copying over 100s of GB of data is the transfer rate going down to USB 2.0 speeds.
In addition to tracking the instantaneous read and write speeds of the DAS when processing the AnandTech DAS Suite, the temperature of the drive was also recorded at the beginning and end of the processing. In earlier reviews, we used to track the temperature all through. However, we have observed that SMART read-outs for the temperature in NVMe SSDs using USB 3.2 Gen 2 bridge chips end up negatively affecting the actual transfer rates. To avoid this problem, we have restricted ourselves to recording the temperature at either end of the actual workloads set. The graphs below present the recorded data.
| Performance Consistency and Thermal Characteristics |
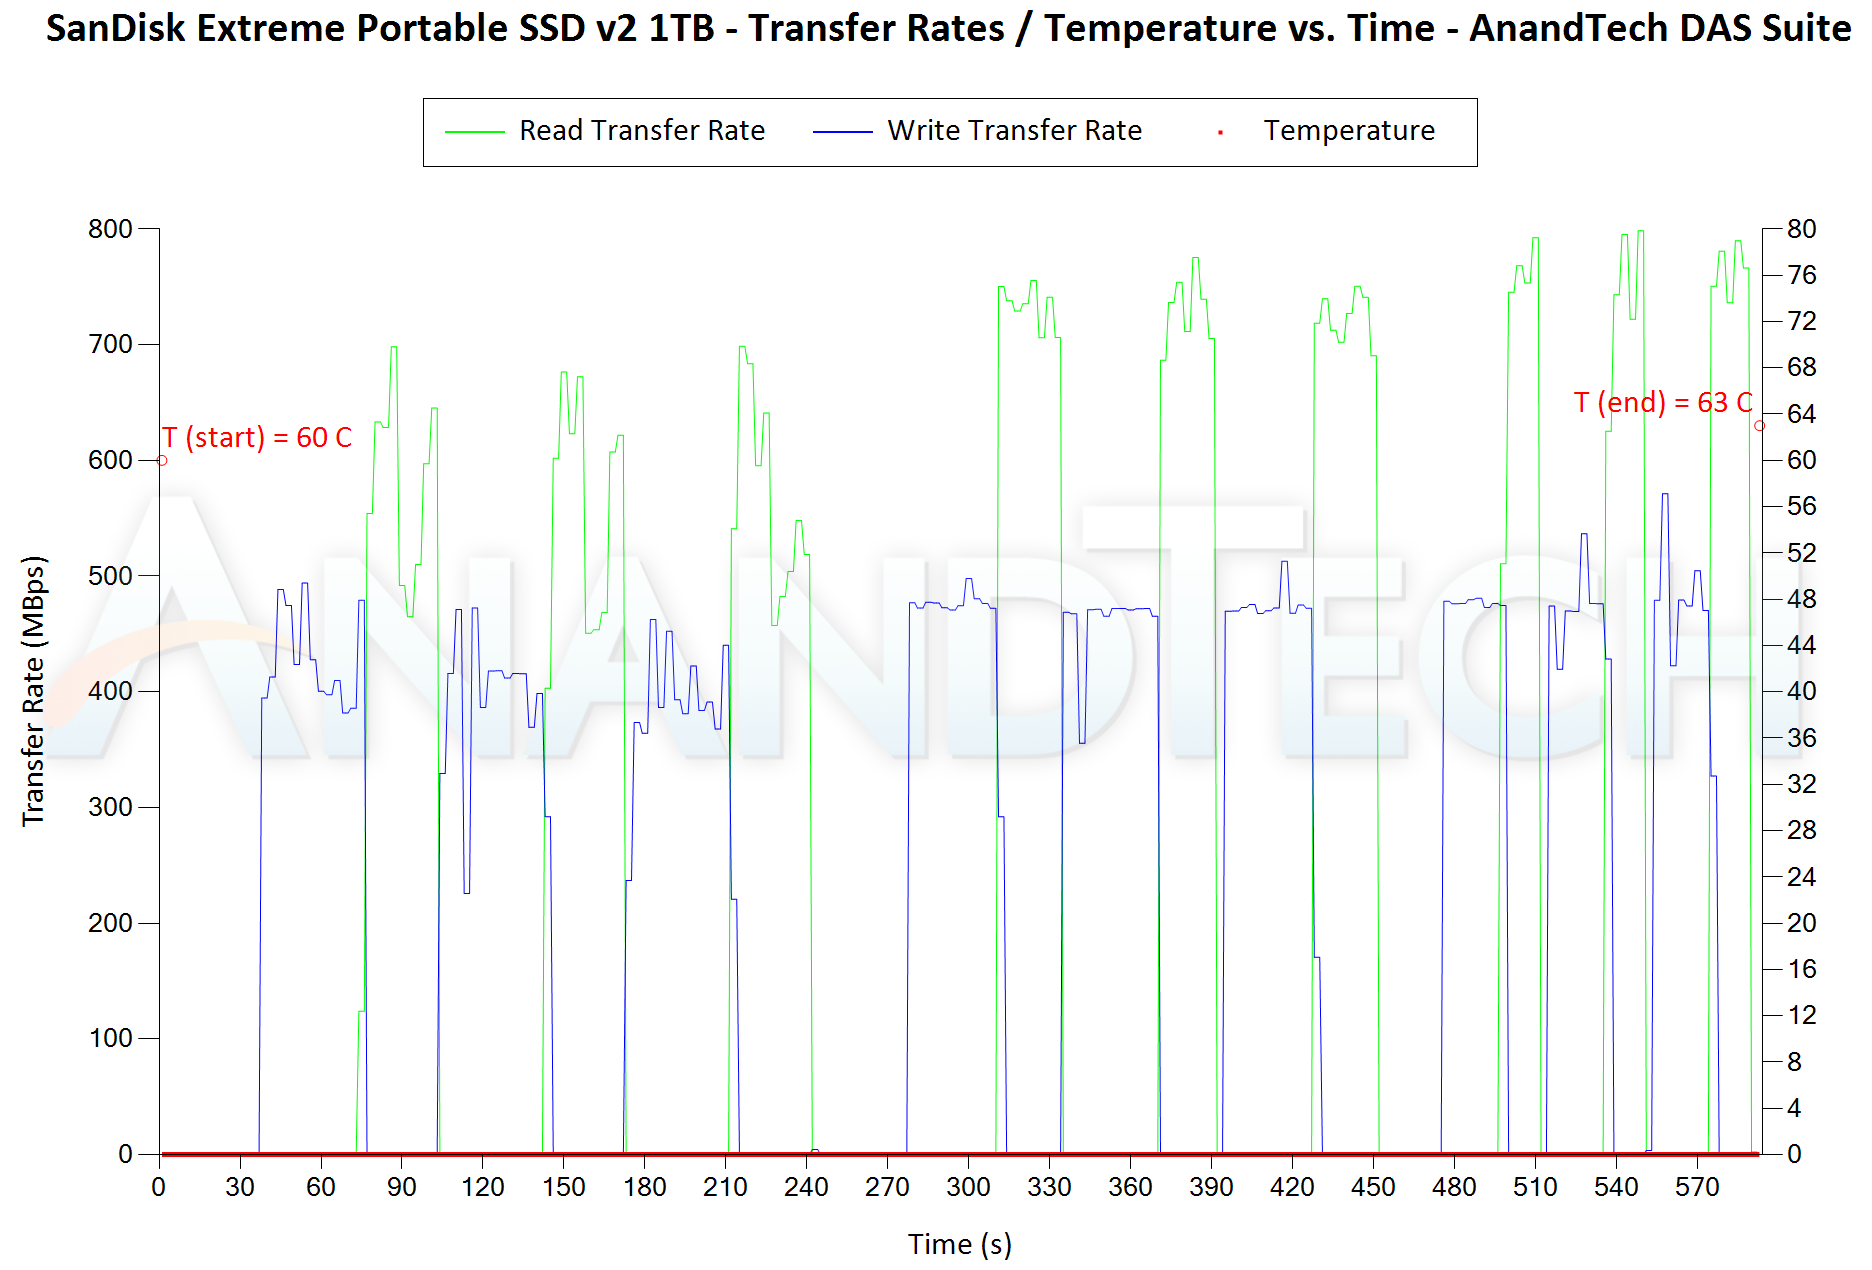 |
The first three sets of writes and reads correspond to the photos suite. A small gap (for the transfer of the video suite from the internal SSD to the RAM drive) is followed by three sets for the video suite. Another small RAM-drive transfer gap is followed by three sets for the Blu-ray folder. An important point to note here is that each of the first three blue and green areas correspond to 15.6 GB of writes and reads respectively. The consistency shown across different passes of the same workload show that no thermal throttling is at play for either SSD. The thermal solution in both perform very similarly for normal workloads - around 3C-4C rise in temperature after around 250GB of reads and writes.
PCMark 10 Storage Bench - Real-World Access Traces
There are a number of storage benchmarks that can subject a device to artificial access traces by varying the mix of reads and writes, the access block sizes, and the queue depth / number of outstanding data requests. We saw results from two popular ones - ATTO, and CrystalDiskMark - in a previous section. More serious benchmarks, however, actually replicate access traces from real-world workloads to determine the suitability of a particular device for a particular workload. Real-world access traces may be used for simulating the behavior of computing activities that are limited by storage performance. Examples include booting an operating system or loading a particular game from the disk.
PCMark 10's storage bench (introduced in v2.1.2153) includes four storage benchmarks that use relevant real-world traces from popular applications and common tasks to fully test the performance of the latest modern drives:
- The Full System Drive Benchmark uses a wide-ranging set of real-world traces from popular applications and common tasks to fully test the performance of the fastest modern drives. It involves a total of 204 GB of write traffic.
- The Quick System Drive Benchmark is a shorter test with a smaller set of less demanding real-world traces. It subjects the device to 23 GB of writes.
- The Data Drive Benchmark is designed to test drives that are used for storing files rather than applications. These typically include NAS drives, USB sticks, memory cards, and other external storage devices. The device is subjected to 15 GB of writes.
- The Drive Performance Consistency Test is a long-running and extremely demanding test with a heavy, continuous load for expert users. In-depth reporting shows how the performance of the drive varies under different conditions. This writes more than 23 TB of data to the drive.
Despite the data drive benchmark appearing most suitable for testing direct-attached storage, we opted to run the full system drive benchmark as part of our evaluation flow. Many of us use portable flash drives as boot drives and storage for Steam games. These types of use-cases are addressed only in the full system drive benchmark.
The Full System Drive Benchmark comprises of 23 different traces. For the purpose of presenting results, we classify them under five different categories:
- Boot: Replay of storage access trace recorded while booting Windows 10
- Creative: Replay of storage access traces recorded during the start up and usage of Adobe applications such as Acrobat, After Effects, Illustrator, Premiere Pro, Lightroom, and Photoshop.
- Office: Replay of storage access traces recorded during the usage of Microsoft Office applications such as Excel and Powerpoint.
- Gaming: Replay of storage access traces recorded during the start up of games such as Battlefield V, Call of Duty Black Ops 4, and Overwatch.
- File Transfers: Replay of storage access traces (Write-Only, Read-Write, and Read-Only) recorded during the transfer of data such as ISOs and photographs.
PCMark 10 also generates an overall score, bandwidth, and average latency number for quick comparison of different drives. The sub-sections in the rest of the page reference the access traces specified in the PCMark 10 Technical Guide.
Booting Windows 10
The read-write bandwidth recorded for each drive in the boo access trace is presented below.
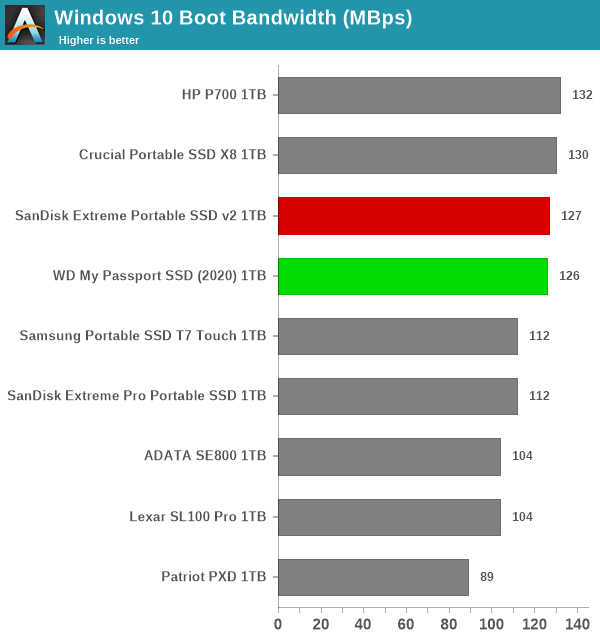
Both SSDs appear in the top half of the chart, and are off from the leader by a small margin.
Creative Workloads
The read-write bandwidth recorded for each drive in the sacr, saft, sill, spre, slig, sps, aft, exc, ill, ind, psh, and psl access traces are presented below.
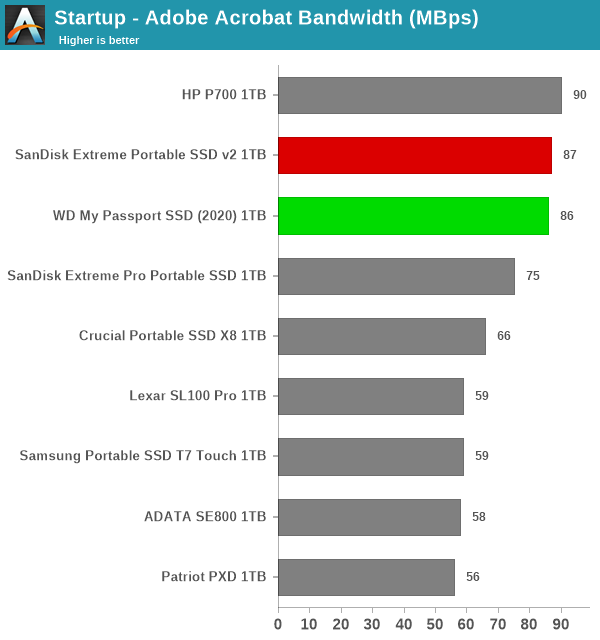
In almost all of the creative workloads, the two SSDs miss out on the top spot by a whisker to the HP Portable SSD P700.
Office Workloads
The read-write bandwidth recorded for each drive in the exc and pow access traces are presented below.
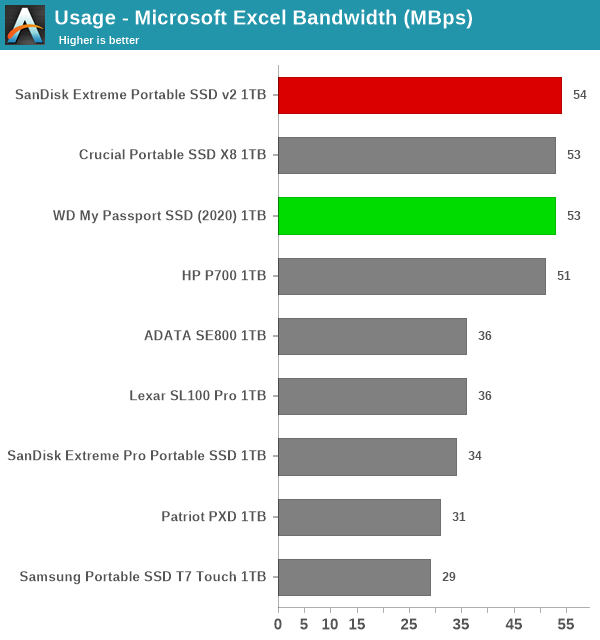
The SSDs come out in the top half again with at least one pole position - however, the HP P700 performs almost as well for the office workloads.
Gaming Workloads
The read-write bandwidth recorded for each drive in the bf, cod, and ow access traces are presented below.
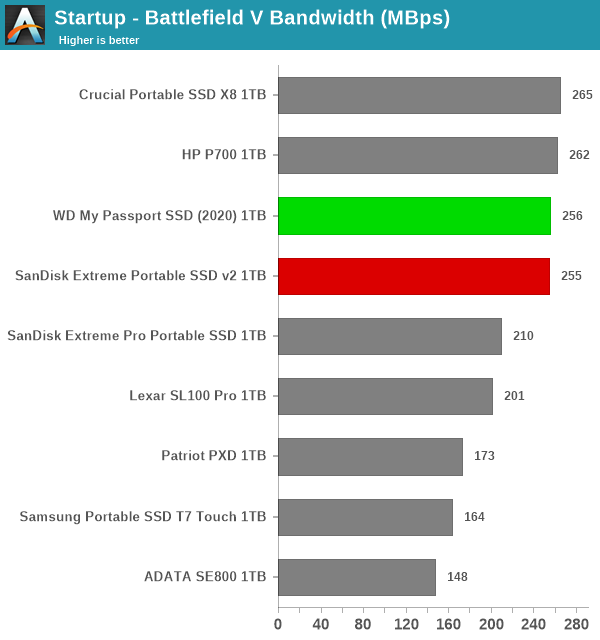
The observations repeat for the gaming workloads - the two SSDs are neck-to-neck with the HP P700 (for write-heavy workloads) and the Crucial Portable SSD X8 (for the read-heavy ones).
Files Transfer Workloads
The read-write bandwidth recorded for each drive in the cp1, cp2, cp3, cps1, cps2, and cps3 access traces are presented below.
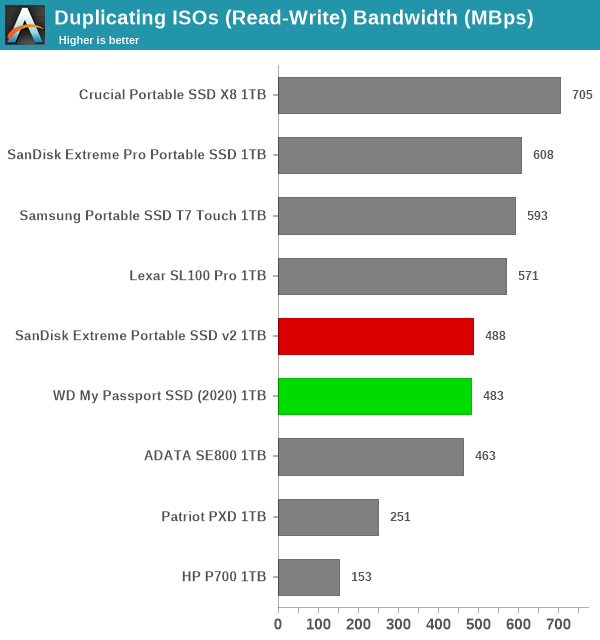
Mixed workloads involving large file sizes seem to trip up the two SSDs, but the drives emerge in pole position in the other file transfer workloads.
Overall Scores
PCMark 10 reports an overall score based on the observed bandwidth and access times for the full workload set. The score, bandwidth, and average access latency for each of the drives are presented below.
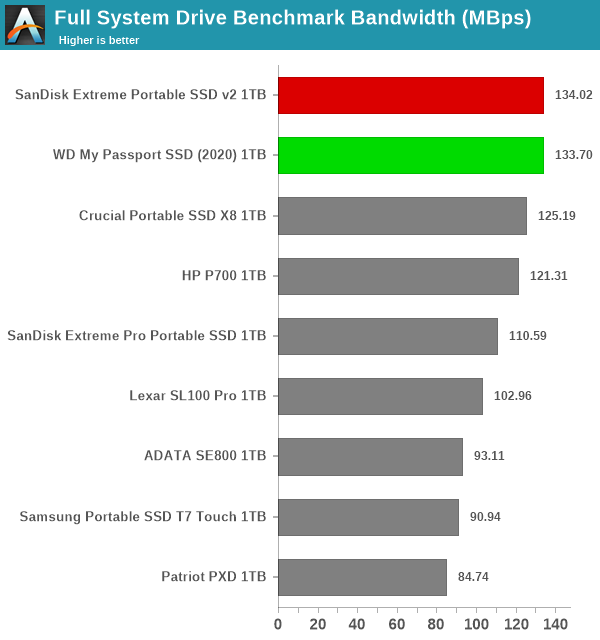
From an overall perspective, the SanDisk Extreme Portable SSD v2 and the WD My Passport SSD (2020) come out on top by a significant margin. This points to an all-round performance, while other competing SSDs are optimized for one type of workload only.
Miscellaneous Aspects and Concluding Remarks
The performance of the drives in various real-world access traces as well as synthetic workloads was brought out in the preceding sections. We also looked at the performance consistency for these cases. Power users may also be interested in performance consistency under worst-case conditions, as well as drive power consumption. The latter is also important when used with battery powered devices such as notebooks and smartphones. Pricing is also an important aspect. We analyze each of these in detail below.
Worst-Case Performance Consistency
Flash-based storage devices tend to slow down in unpredictable ways when subject to a large number of small-sized random writes. Many benchmarks use that scheme to pre-condition devices prior to the actual testing in order to get a worst-case representative number. Fortunately, such workloads are uncommon for direct-attached storage devices, where workloads are largely sequential in nature. Use of SLC caching as well as firmware caps to prevent overheating may cause drop in write speeds when a flash-based DAS device is subject to sustained sequential writes.
Our Sequential Writes Performance Consistency Test configures the device as a raw physical disk (after deleting configured volumes). A fio workload is set up to write sequential data to the raw drive with a block size of 128K and iodepth of 32 to cover 90% of the drive capacity. The internal temperature is recorded at either end of the workload, while the instantaneous write data rate and cumulative total write data amount are recorded at 1-second intervals.
| Sequential Write to 90% of Disk Capacity - Performance Consistency |
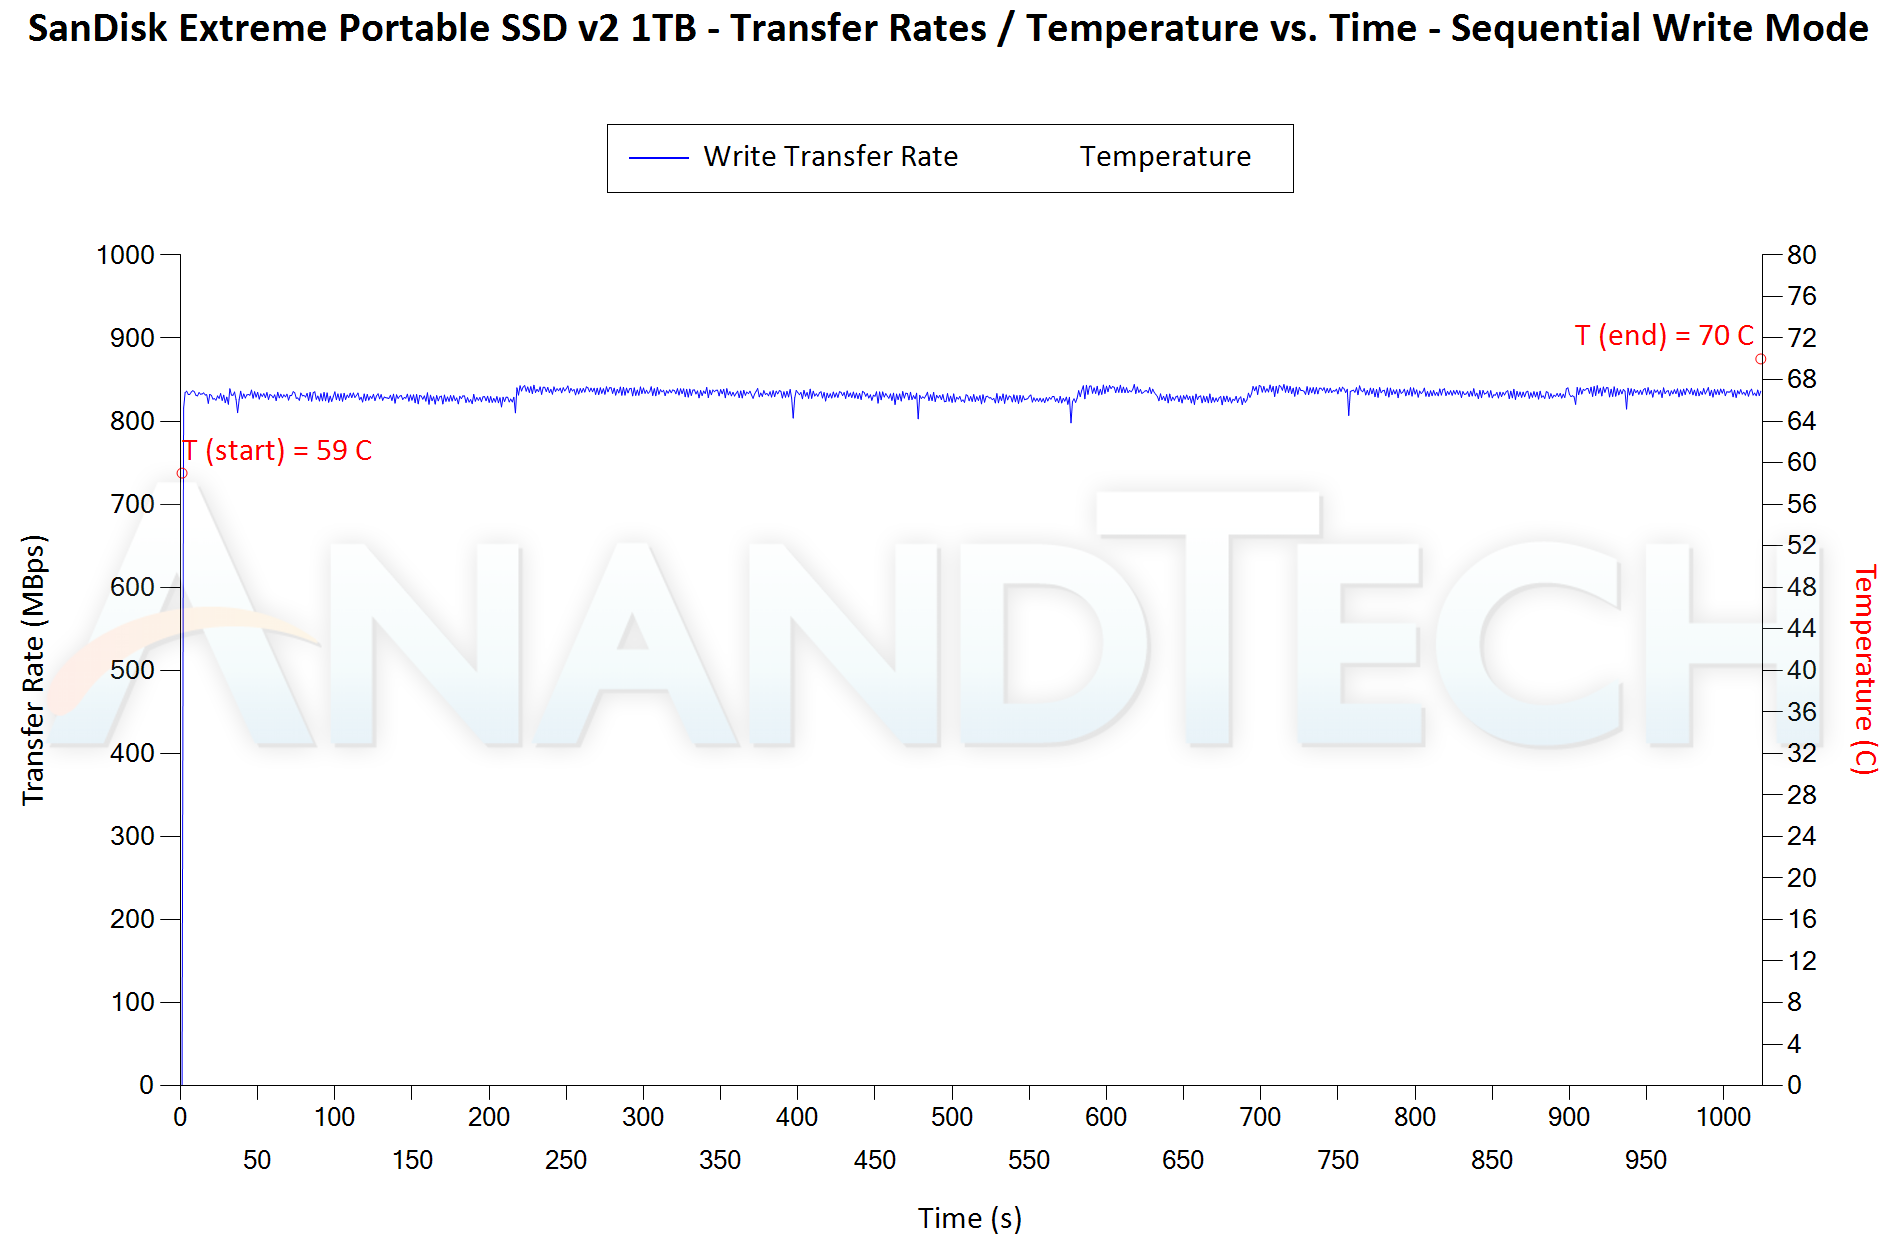 |
The Extreme v2 maintains speeds between 815 - 850 MBps throughout the write workload (up to 90% of drive capacity), with the temperature ending up at 70C. (11C delta). In terms of performance numbers, it is almost as good as the Extreme PRO from 2019 which stayed at 850 MBps throughout. The My Passport SSD (2020) starts off with similar speeds as the Extreme v2, and stays there for around 15 seconds (~13GB of write data), before dropping down to around 670 MBps (which is sustained throughout the workload). The temperature does end up at 76C (21C delta). Normally, one would assume that the 13GB change-over is the effect of SLC caching, but the absence of the cliff in the Extreme v2 points to something else - the SanDisk Extreme v2 has a little higher thermal capacity compared to the My Passport SSD (2020). This allows a slightly higher bump up in performance for the former. In other words, Western Digital is more proactive in throttling the My Passport when there is a possibility of rapid temperature rise.
Power Consumption
Bus-powered devices can configure themselves to operate within the power delivery constraints of the host port. While Thunderbolt 3 ports are guaranteed to supply up to 15W for client devices, USB 2.0 ports are guaranteed to deliver only 4.5W (900mA @ 5V). In this context, it is interesting to have a fine-grained look at the power consumption profile of the various drives. Using the Plugable USBC-TKEY, the bus power consumption of the drives was tracked while processing the CrystalDiskMark workloads (separated by 30s intervals). The graphs below plot the instantaneous bus power consumption against time, while singling out the maximum and minimum power consumption numbers.
| Drive Power Consumption - CrystalDiskMark Workloads |
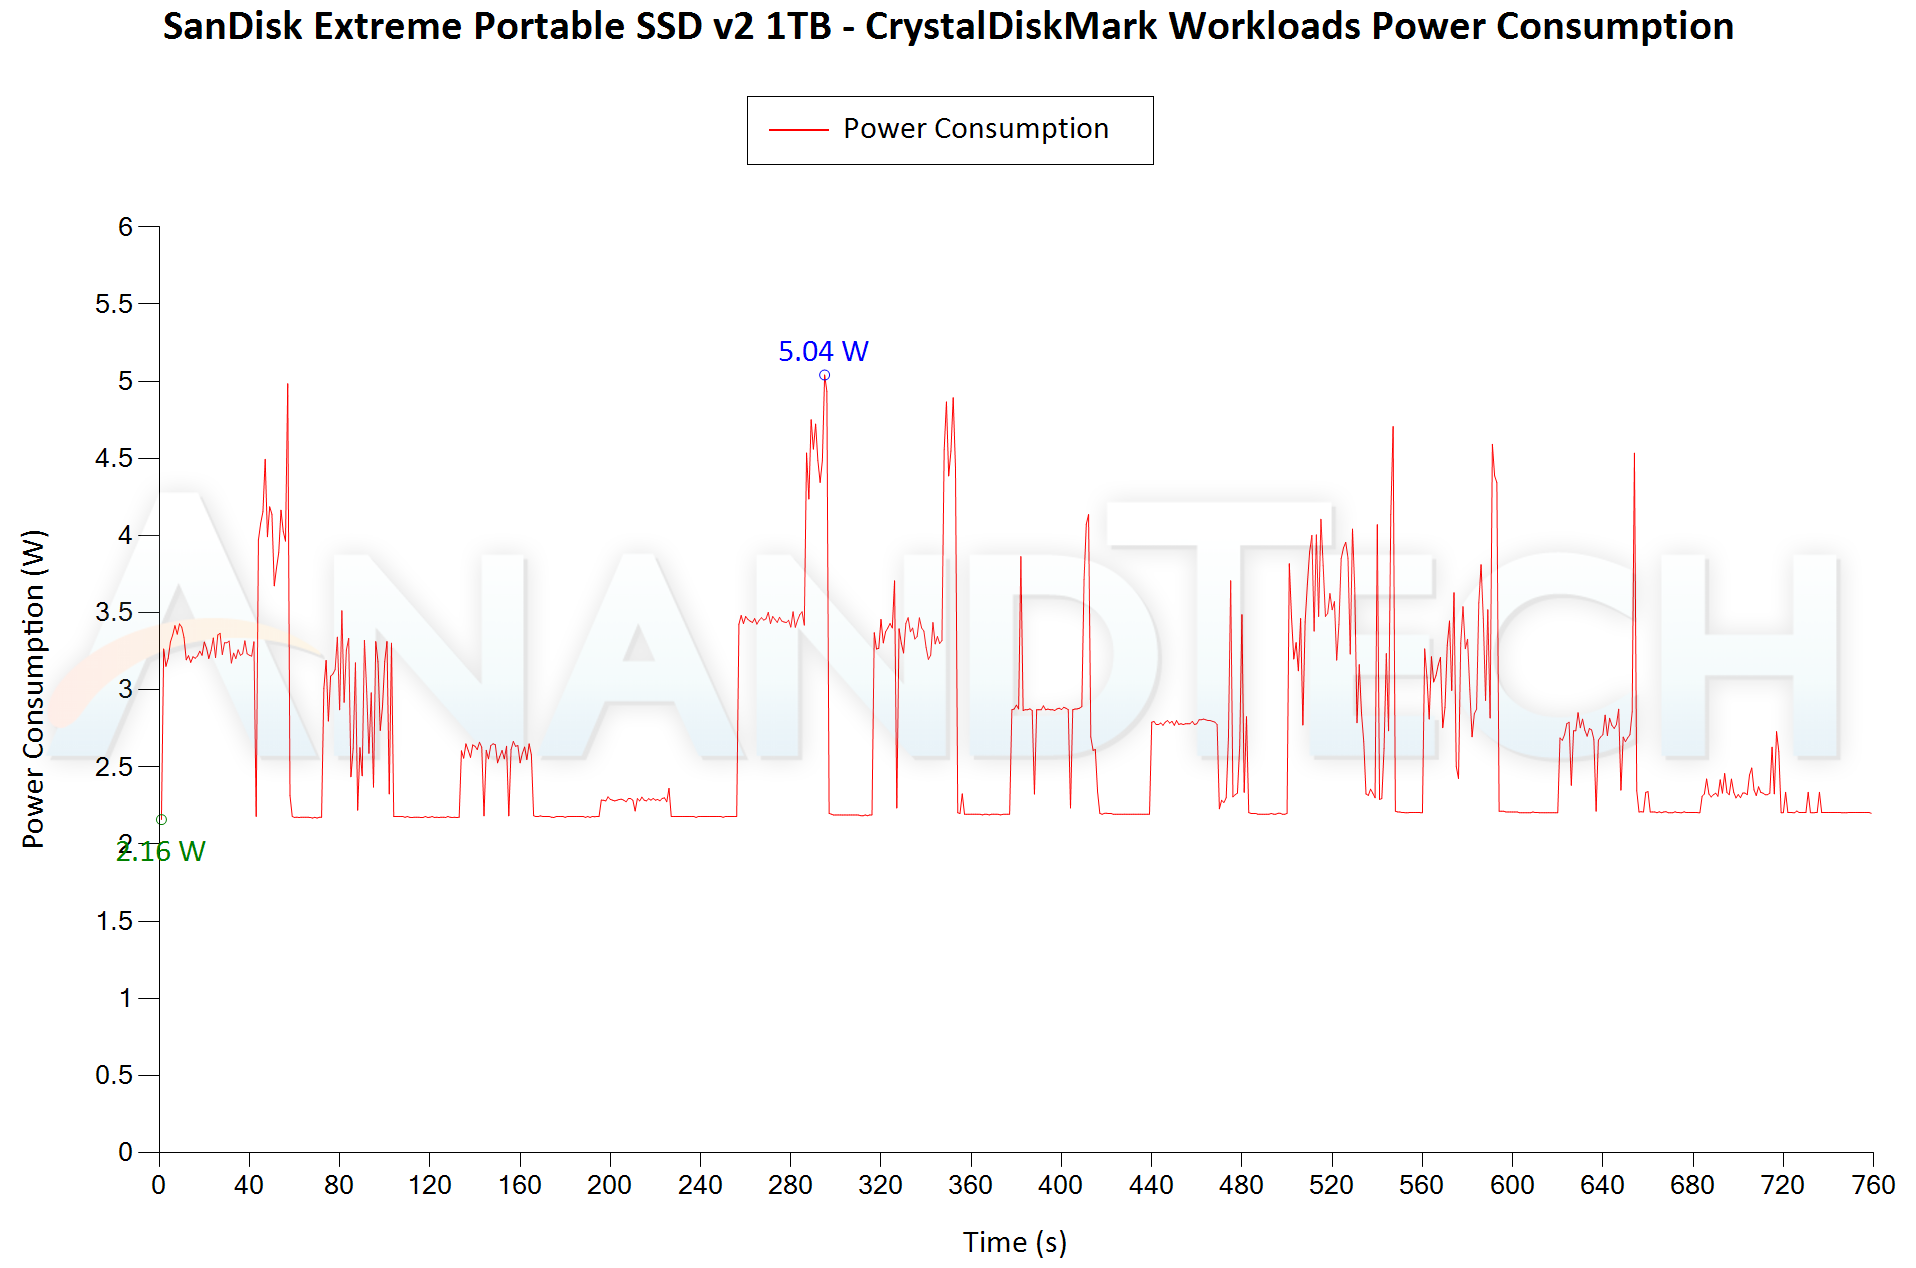 |
The two SSDs clock in between 2.1W and 5W for the workloads. These are not the most power efficient external SSDs, as the Samsung T7 Touch operates between 0.6W and 4W for the same workloads. These numbers are fine for usage with desktops and high-performance notebooks, but the aspect needs to be kept in mind when using them with mobile phones and tablets.
Pricing
The price of flash-based storage devices tend to fluctuate quite a bit over time. However, the relative difference between different models usually doesn't change. The table below summarizes the product links and pricing for the various units discussed in the review.
| External Flash Storage Devices - Pricing | ||||
| Product | Model Number | Capacity (GB) | Street Price (USD) | Price per GB (USD/GB) |
| ADATA SE800 1TB | ASE800-1TU32G2-CBK | 1000 | $130 | 0.13 |
| Crucial Portable SSD X8 1TB | CT1000X8SSD9 | 1000 | $150 | 0.15 |
| WD My Passport SSD (2020) 1TB | WDBAGF0010BGY-WESN | 1000 | $150 | 0.15 |
| Patriot PXD 1TB | PXD1TBPEC | 1000 | $170 | 0.17 |
| HP P700 1TB | 5MS30AA#ABC | 1000 | $175 | 0.175 |
| Lexar SL100 Pro 1TB | LSL100P-1TBRBNA | 1000 | $190 | 0.19 |
| Samsung Portable SSD T7 Touch 1TB | MU-PC1T0S/WW | 1000 | $190 | 0.19 |
| SanDisk Extreme Pro Portable SSD 1TB | SDSSDE80-1T00-A25 | 1000 | $190 | 0.19 |
| SanDisk Extreme Portable SSD v2 1TB | SDSSDE61-1T00 | 1000 | $240 | 0.24 |
The WD My Passport SSD (2020) offers excellent value for money. The verdict on the SanDisk Extreme Portable SSD v2 can be given only after the street pricing is known. That said, even if it were to be $200, we can say that the performance and consistency are worth it.
Final Words
After careful analysis of various aspects (including benchmark numbers, temperatures, power consumption, and pricing), it is clear that the WD My Passport SSD (2020) and the SanDisk Extreme Portable SSD v2 are both excellent choices for a wide variety of applications. However, as the adage goes - one can't have the cake and eat it too. Both SSDs deliver the performance and consistency at the cost of increased power consumption and slightly high temperatures. Optimizing for those metrics would mean losing out on the aspects that deliver instant gratification - getting transfers done quickly without any throttling. However, those very metrics might turn out to be of key concern in certain scenarios. Therefore, the right choice depends on the use-case. Based on our tests, the SanDisk Extreme Portable SSD v2 effectively serves the needs of content creators who need to use it in the field (thanks to its carabiner loop, IP55 rating, and 2m drop protection). The WD My Passport SSD (2020) is a better fit for the casual home / business user.
The SanDisk Extreme PRO Portable SSD (2019) model continues to be our favorite / recommended portable SSD as long as it is not EOL-ed. The use of a high-end SSD (non-DRAM-less) and a better thermal solution in the unit ensures that it surpasses the SanDisk Extreme v2 and the My Passport SSD across all metrics except for power consumption. Despite the suggested retail price of $200 for the new 1TB Extreme v2, e-tailers are pricing it at $240. The premium is not justified as long as the $190 Extreme PRO (2019) is available in the market. Once the street price starts approaching the 20c/GB mark, the SanDisk Extreme Portable SSD v2 will climb to the second spot. The WD My Passport SSD (2020) is recommended for casual users who do not need the IP55 rating and need an economical yet stylish portable drive. Even if its performance consistency doesn't match the Extreme v2, the value and performance proposition is quite strong compared to the other options in the market.


7 Comments
View All Comments
repoman27 - Wednesday, September 30, 2020 - link
"While Thunderbolt 3 ports are guaranteed to supply up to 15W for client devices, USB 2.0 ports are guaranteed to deliver only 4.5W (900mA @ 5V)."USB 2.0 ports are only guaranteed for 2.5 W (500 mA @ 5 V). 4.5 W is for USB3 ports, although USB 3.2 Type-C ports in dual-lane mode must support at least 7.5 W (1,500 mA @ 5 V). Also, for Thunderbolt 3 ports to deliver more than 4.5 W requires the connected device to support USB Power Delivery.
repoman27 - Wednesday, September 30, 2020 - link
Thunderbolt 3 ports could also support 7.5 W (1,500 mA @ 5 V) and 15 W (3.0 A @ 5 V) via USB Type-C current advertisement, but that would be implementation specific. I wonder how broadly supported that is, or if there are any devices that can take advantage of it?fazalmajid - Wednesday, September 30, 2020 - link
Why are these drives so wide and bulky compared to the current crop of NVMe M.2 2280 to USB-C 3.1 enclosures? The SanDisk is almost twice as wide as my Plugable (sic).brutedawg - Wednesday, September 30, 2020 - link
Maybe old habits. It seems easily construed as a familiarity aesthetic with previous generation pocket-sized portable drives. You made me look up NVME enclosures and now I'm woke enough to consider one for personal use.gfody - Saturday, October 3, 2020 - link
So whatever happened to 20Gbps (USB 3.2 Gen 2x2) - we saw the ASUS U32 20G enclosure reviewed over a year ago hit 2GB/s but then never hit the market (at least not the US market)ganeshts - Tuesday, October 6, 2020 - link
https://www.anandtech.com/show/16133/usb-32-gen-2x...casperes1996 - Saturday, October 3, 2020 - link
Not sure if the WD division has as good support, but one advantage is also just how great SanDisk's support it. Had an Extreme Portable 510 that died a bit after warranty ran out. It was weird - from one moment to the next it stopped being recognised entirely. Even though it was past warranty, SanDisk sent me a box to ship it back to them in and I promptly got a replacement unit